
The jury pool for the District Court of Delaware differs from other key patent venues and has a significant population of African Americans. Compared to venues in the Northern and Central Districts of California, the District of Delaware has a somewhat strong Republican base. However, compared to the Eastern District of Texas, the District’s Republican base seems small.
Surprisingly, 10% of the workers in Delaware are part of the industry encompassing Finance, Insurance, and Real Estate, while only 4% of workers in the Marshall Division work in that same industry.
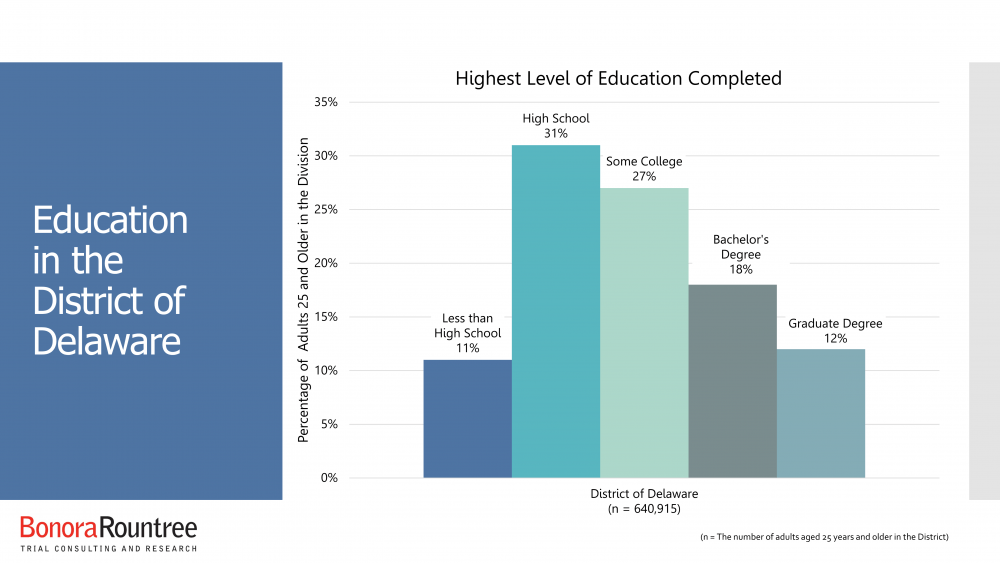
Within the District, only 27% of households earn more than $100K, which is much less than that of either the San Jose Division (46%) or the Oakland/San Francisco Division (39%) in the Northern District of California. The District of Delaware also differs dramatically from these Northern District of California venues in the level of education with 30% having a Bachelor’s degree or higher in Delaware, contrasted with 43% in San Jose and 47% in the Oakland/San Francisco Division.
These are the latest jury pool demographics for the District:
- 21% African American
- 70% have not graduated from college
- 32 % of households earn $50K-$100K
- 10% work in the Finance/Insurance/Real Estate Industry
- 28% Republican


Demographic Data from 2016 American Community Survey (Census.gov)
2017 Voter Registration Statistics from State Government
https://elections.delaware.gov/services/candidate/regtotals.shtml